Running an analysis
An analysis is a job. Soterre creates it, the Analyzer queues it, and Soterre polls until it finishes.
What you provide
Soterre identifies the target by ids:
| Field | What it is |
|---|---|
connectionId | Which tenant connection to authenticate with |
workspaceId | The workspace holding the report |
reportId | The report to analyze. A semantic model is inspected as part of the report that uses it. |
kind | report. semanticModel is in the contract but rejected by the service — see below |
Optionally a description (free text that travels with the job, useful for saying which release this was), a timeout, and a list of flag sets to restrict which flags are checked.
Launching analysis
Open the report
Open Power BI report in Soterre using the accordeon and navigate to the Inspections tab.
Click Inspect
Click Inspect to launch the analysis. Model flags, DAX complexity and page flags are all checked in one pass over the model and the report layout.
Review the results
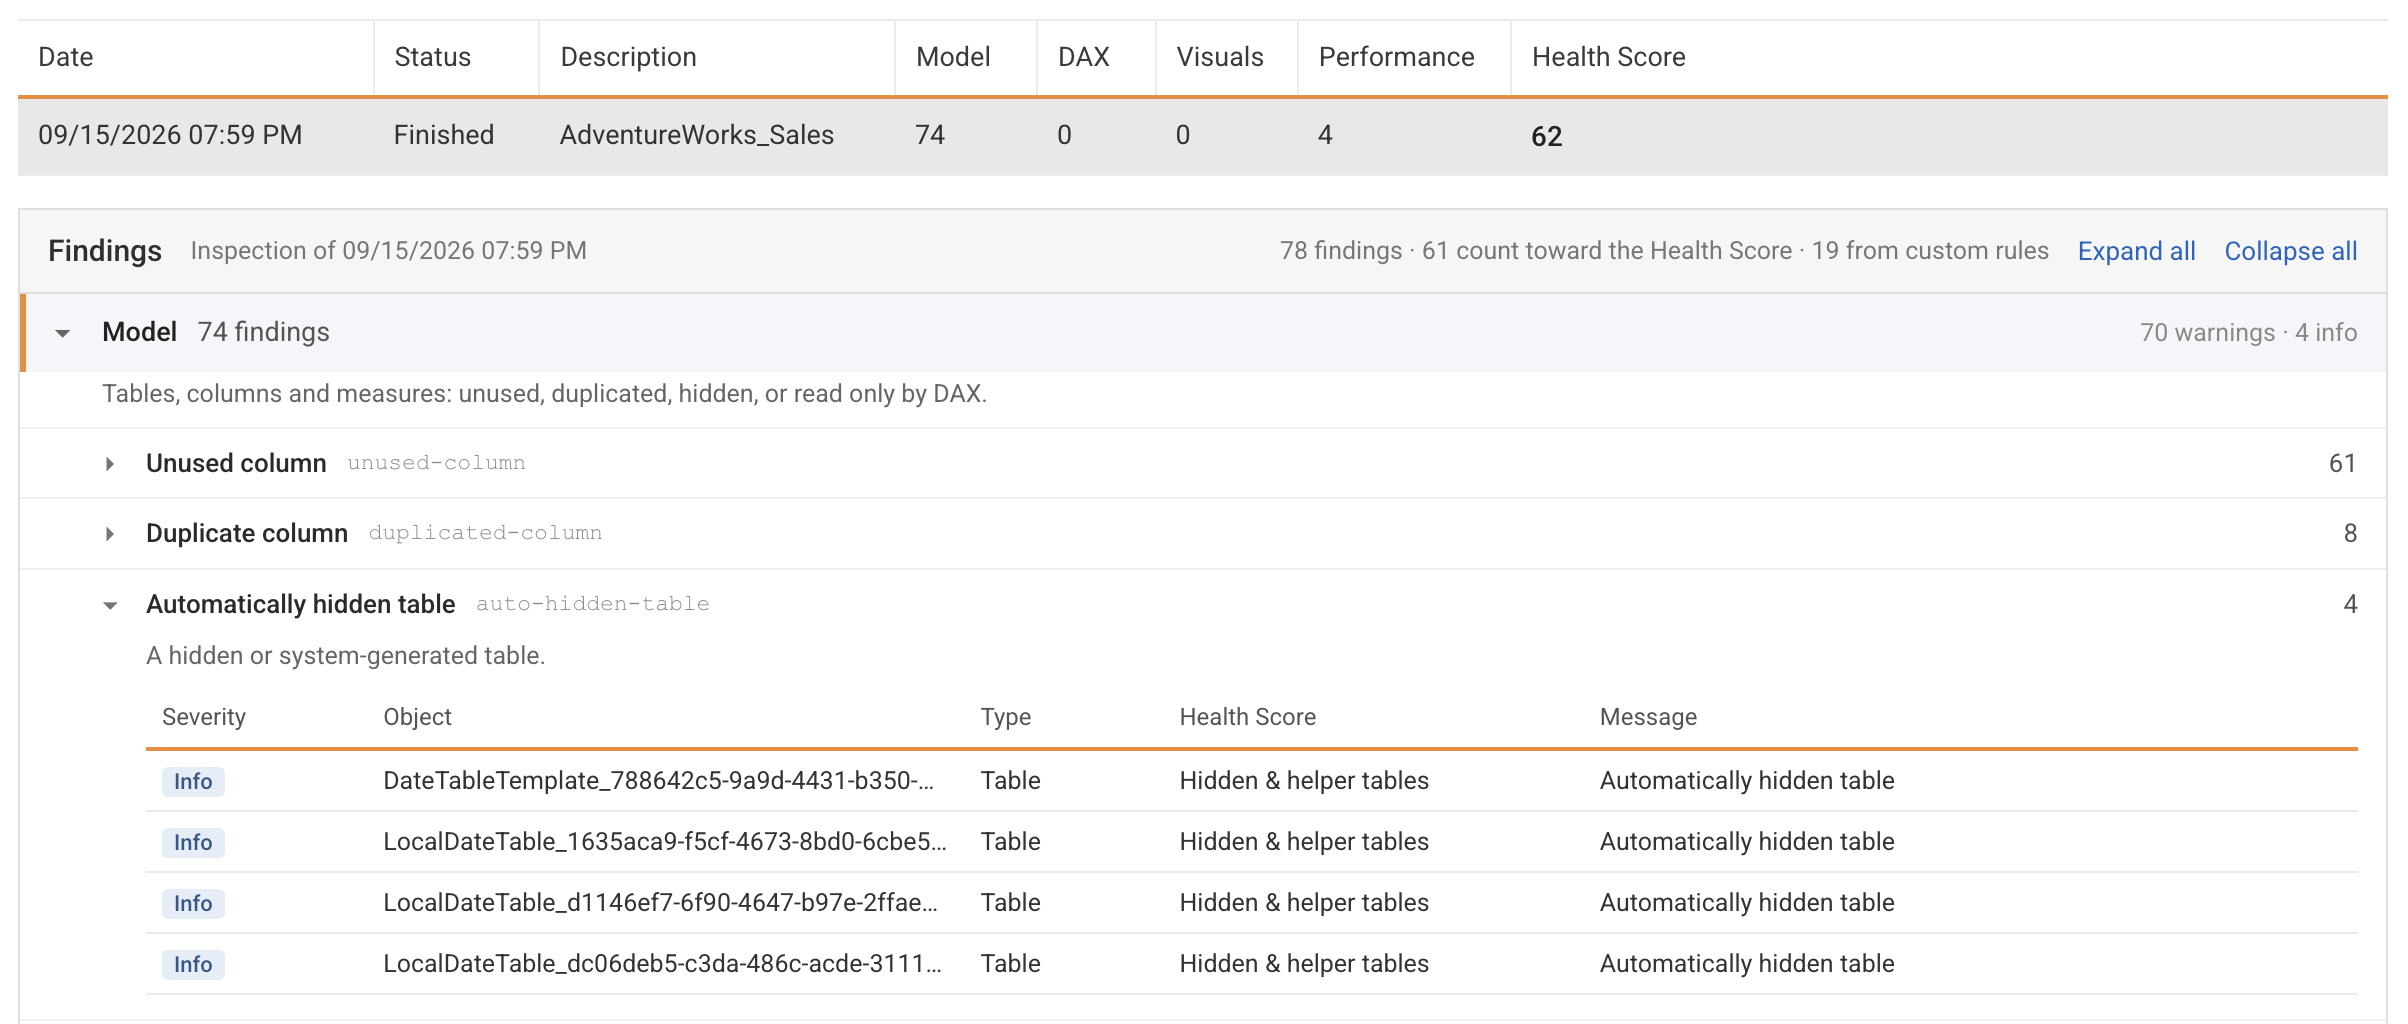
Analysis findings appear as the record on the page with Date, Status, Description, 4 flag categories, and Health Score. Detailed analysis findings can be seen in a table right under the record. Expand the lines to break down finsings by object. See How flags work.
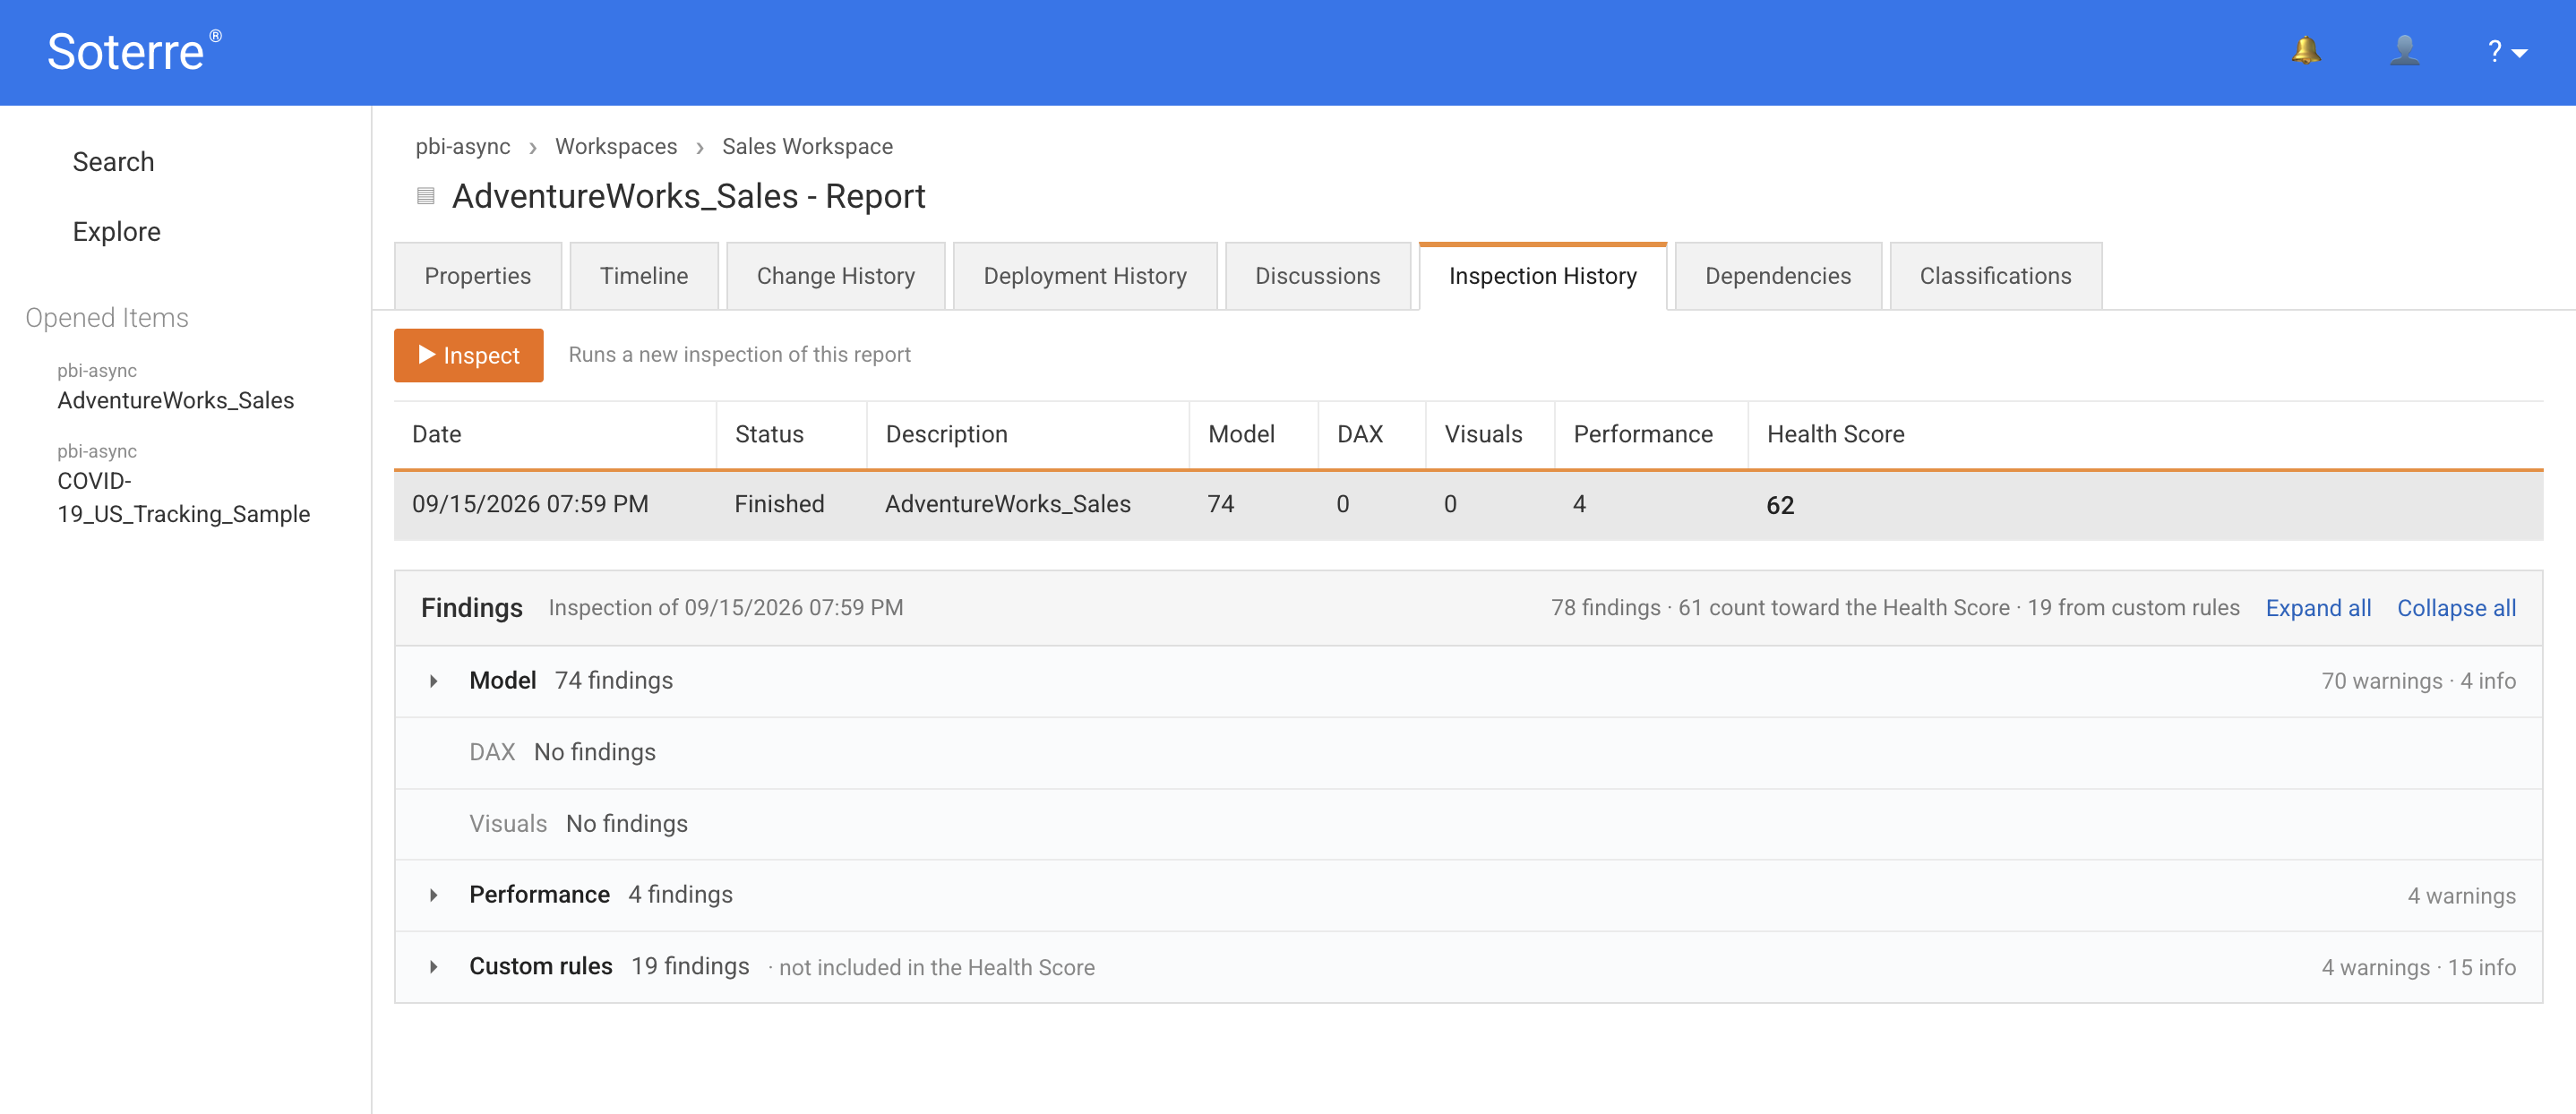
Progress is reported as a percentage while this runs, alongside a live flag count.
Flags and findings
Results are organised on three levels.
| Level | What it is | Example |
|---|---|---|
| Category | The part of the report a check looked at | Model, DAX, Visuals, Performance |
| Flag | One check, and the issue it looks for | Unused columns |
| Finding | One object that tripped that check | The Sales[Margin LY] column |
A finding is the smallest unit. Three unused columns in your model give you one flag — Unused columns — with three findings under it.
One object can trip more than one check. A measure that is both unused and duplicated appears under two flags, once each, so it accounts for two findings in total.
Expand a flag to see its findings and the objects they name.