Capacity Metrics app
Everything the capacity module knows comes from the Microsoft Fabric Capacity Metrics app. Without it installed and readable, capacity collection has no source.
Install it
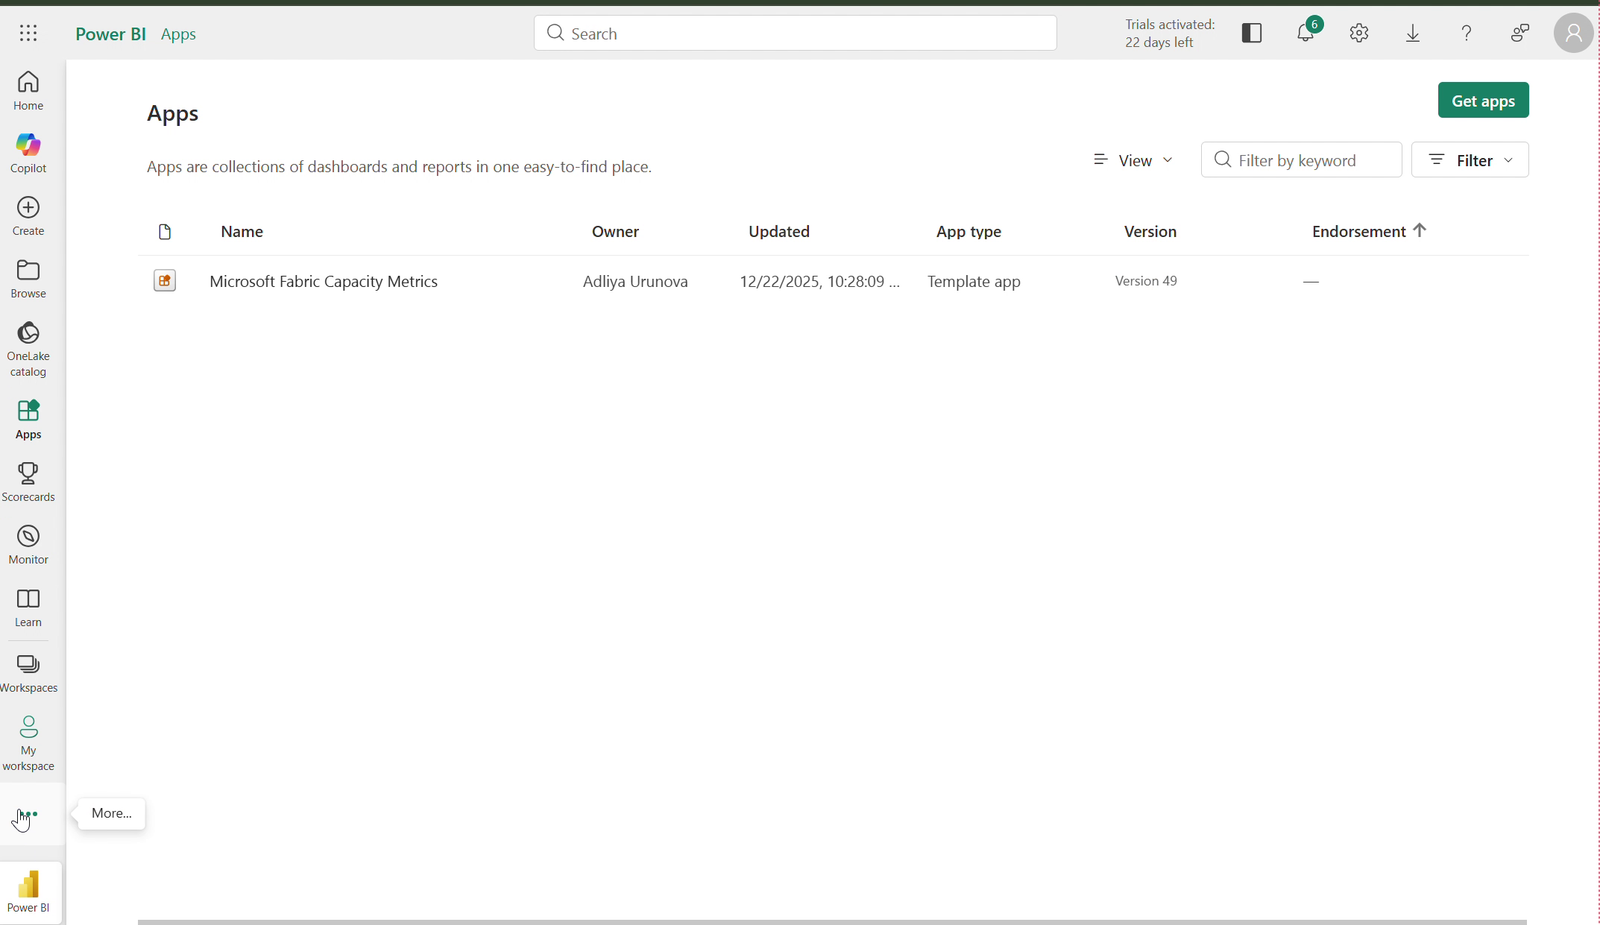
Install the app from AppSource
A capacity admin installs Microsoft Fabric Capacity Metrics from AppSource. It creates a workspace containing a semantic model named Fabric Capacity Metrics.
Point it at a capacity
A fresh installation that nobody has configured reports a single all-zero capacity called Select a capacity from dropdown. The Analyzer skips that placeholder deliberately — otherwise it would log an empty capacity every night, and that emptiness reads as a finding when it is really a setup step someone still owes you.
Grant the Service Principal access
Add the analyzer's Service Principal as a Viewer on the metrics workspace, and give it Build permission on the semantic model so it can run DAX queries against it. Read access alone is not enough — the DAX endpoint needs Build.
Point the connection at it
In the Admin Console, open Connections and click Find Capacity Metrics on the connection. It lists the installations that connection can see; tick the ones collection should read from and save.
You do not need to look up workspace or dataset IDs by hand.
Several installations are normal
Each capacity admin tends to install their own copy, and each installation only reports the capacities that admin administers. One installation therefore sees part of the tenant.
That is why a connection carries a list of metrics sources. To cover a tenant fully, give the Service Principal access to every installation whose capacities you care about.
How installations are found
The Analyzer matches on the semantic model name, which Microsoft fixes as Fabric Capacity Metrics. Workspace names are whatever the installer typed — real examples from a single tenant include Microsoft Fabric Capacity Metrics 7/28/2026, …Workspace and …2. Matching on those would be guesswork.