Custom flags
Beyond the flags that ship with PBI Analyzer, you can write your own - anything your team has agreed on and keeps having to check by hand.
Custom flags are managed in the Custom flags page of the Admin Console, and apply to every analysis the service runs from the next one onward.
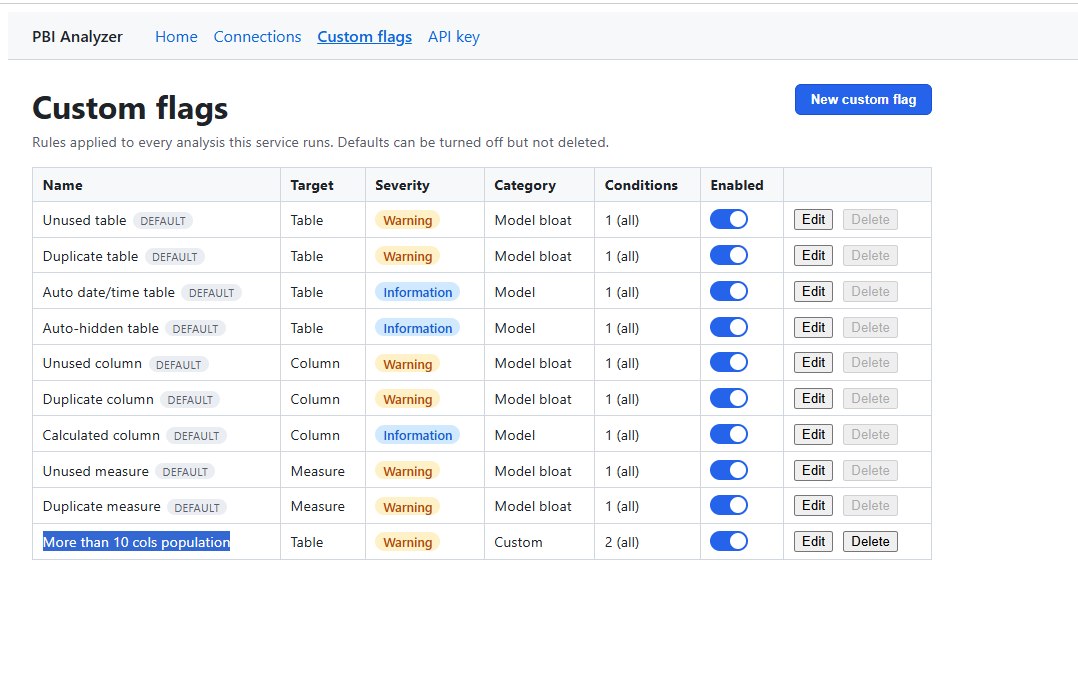
Writing a flag
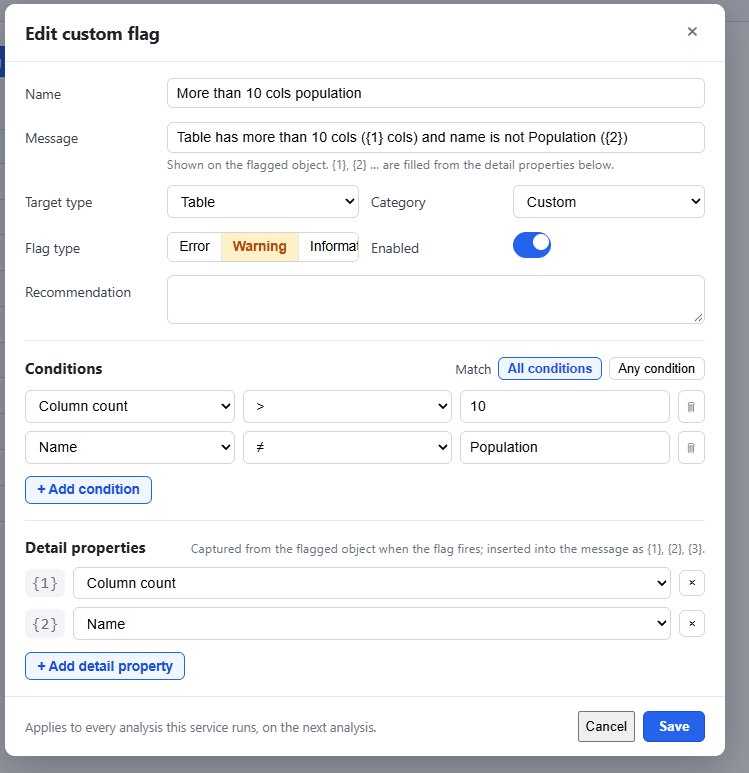
| Field | What it does |
|---|---|
| Name | What the flag is called in the results. Write it as the problem, for example Table has too many columns |
| Message | The sentence shown on each finding. {1}, {2} are filled in from the detail properties below |
| Target type | What the flag examines — one row per table, per column, per page, and so on |
| Category | Which group the flag appears under |
| Flag type | Error, Warning or Information |
| Enabled | Turn the flag off without deleting it |
| Recommendation | What the reader should do about it. Optional, and worth filling in |
| Conditions | What has to be true for the flag to fire |
| Detail properties | Values captured from the flagged object and inserted into the message |
Conditions
Each condition is a property, an operator and a value — Column count > 10, Name ≠ Population, Description is empty.
Match All conditions fires only when every condition holds. Match Any condition fires when at least one does.
The property you pick decides which operators you get:
| Kind of property | Operators |
|---|---|
| Numbers | > < ≥ ≤ = ≠ |
| Yes/no | is true, is false |
| Fixed choices — data type, cardinality | is, is not, in, not in |
| Text | =, ≠, contains, does not contain, starts with, ends with, in, not in, matches, is empty, is not empty |
matches takes a regular expression, which is how naming conventions get enforced: Name does not match ^(Dim|Fact)_.
Category
Pick the one that says where the problem is. These are the same four categories the built-in flags use, so your flag appears alongside them in the results.
| Category | Use it for |
|---|---|
| Model | Tables, columns, measures, relationships |
| DAX | Formulas |
| Visuals | Pages and the visuals on them |
| Performance | Things that cost refresh time or model size |
| Other | Anything that does not fit. Shows under Model in the results |
What you can test
Table
Name, column count, estimated size, description, relationship count, and whether it is unused, duplicated, an auto date/time table, auto-hidden, or referenced in DAX.
Column
Name, table name, data type, estimated size, display folder, data category, format string, summarize-by, sort-by column, description, and whether it is calculated, hidden, a key, unused or duplicated.
Measure
Name, table, the DAX expression itself, expression length, display folder, format string, data type, description, whether it is hidden, unused or duplicated — plus its DAX complexity score, complexity severity, iterator count and repeated heavy calls.
Relationship
Whether it is active, its cross-filter direction, and its cardinality.
Report page
Visual count, slicer count, card count, table visual count, non-data visual count, and counts per visual type — buttons, images, text boxes, shapes.
Visual
Its page, visual type, field count, width and height, whether it has an implicit measure, whether it is off-canvas, and whether it is a custom or non-certified visual.
Model
One row for the whole model: table, column, measure, relationship and page counts, inactive relationships, bidirectional relationships and auto date/time tables.
Some properties are worked out by the analyzer
Properties like Is unused, DAX complexity score or Is off-canvas do not exist in Power BI — the analyzer computes them while it inspects. They are marked in the editor, and they are what make a custom flag able to build on work the analyzer has already done.
Custom flags and the Health Score
Custom flags do not affect the Health Score. They appear in the results with their findings and are left out of the score.
Worth knowing
Changes apply to the next analysis. Existing results are not re-evaluated, so a report inspected before you added a flag will not show it until it is analyzed again.
Flags apply to every analysis this service runs — every tenant and every report, not one connection.
Start narrow. A flag that fires on half the model produces a wall of findings nobody reads. Add the condition that excludes the legitimate cases before you enable it.